Make safer and more profitable Investment decisions
Everyone wants to know when to buy, sell, or hold a stock. FAST Graphs reveals this by clearly illustrating the value of the business relative to its stock price.
Become a better investor with FAST Graphs
Investing in good businesses is key to above-average returns, and FAST Graphs helps you identify those businesses faster than ever before. Simple, but interactive, charts quickly let you identify valuation so you know when to buy, sell, and hold a stock.
How does it help YOU?
Unlock the secret to smart investing with FAST Graphs: your gateway to understanding true company value. Imagine never overpaying for a stock again—why invest $1000 in what’s only worth $500? Let FAST Graphs guide your investments, ensuring your money works as diligently as you do.
Understand the business that drives the stock price
Is it a fast-growing business? Is it cyclical? Are the earnings collapsing? This is what FAST Graphs shows you immediately. You need to know the business before you invest because the business drives the stock price.
Decide if it’s worth investing in
Are you paying too much for the company? Do the return expectations meet what you need in an investment? All of these questions can be answered quickly just by looking at FAST Graphs. Figure out if you are overpaying for a stock, or investing in a company that isn’t growing fast enough to meet your goals and needs. Are you worried about income? FAST Graphs has this covered too.
Track your investments
Once you’ve found a great business to invest in, you should be able to follow it and track it like a pro. FAST Graphs’ portfolio management system can do this for you. Stay on top of your portfolio’s diversification, review your dividend income, and much more.
Our solutions
Investing isn’t easy, but a tool like FAST Graphs assists in the process – for beginners and professionals
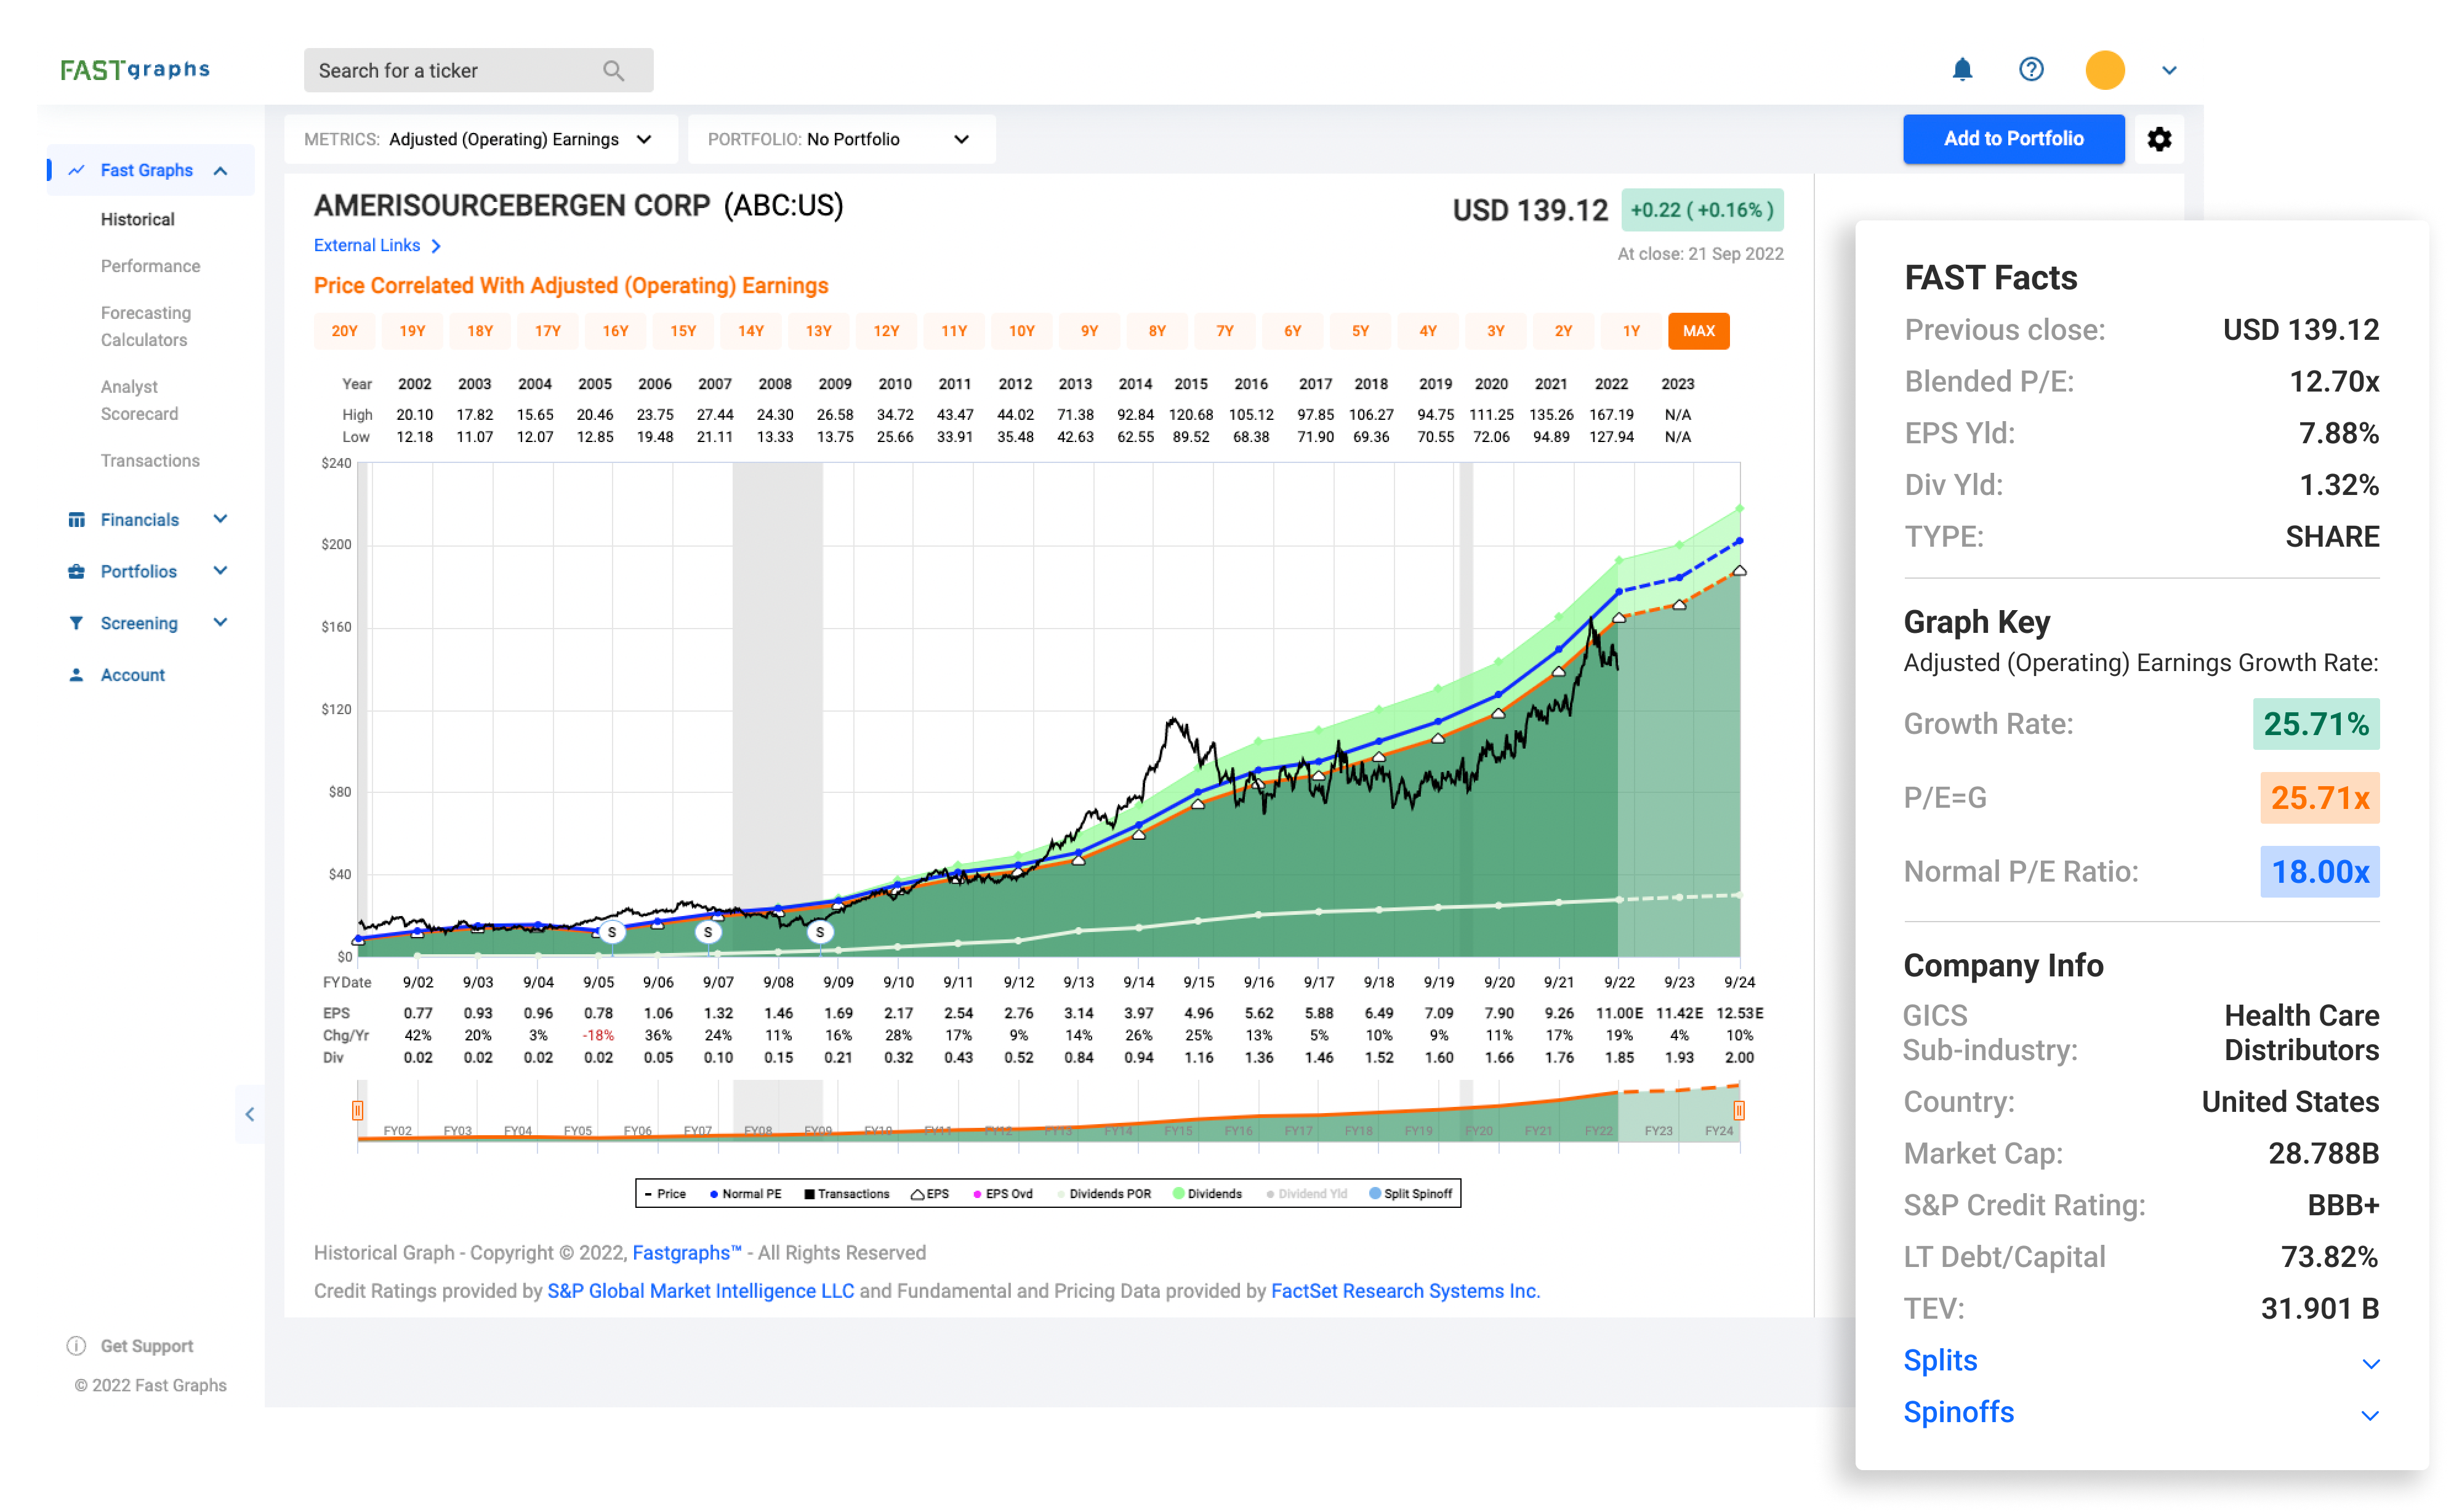
Visualize the relationship of operating results to stock price performance on thousands of companies.
Learn more about FAST Graphs
Dive deep into company financials to help get an understanding of the numbers behind a company. You’ll have access to full financial statements and powerful graphing features to help you uncover data.
Learn more about Financials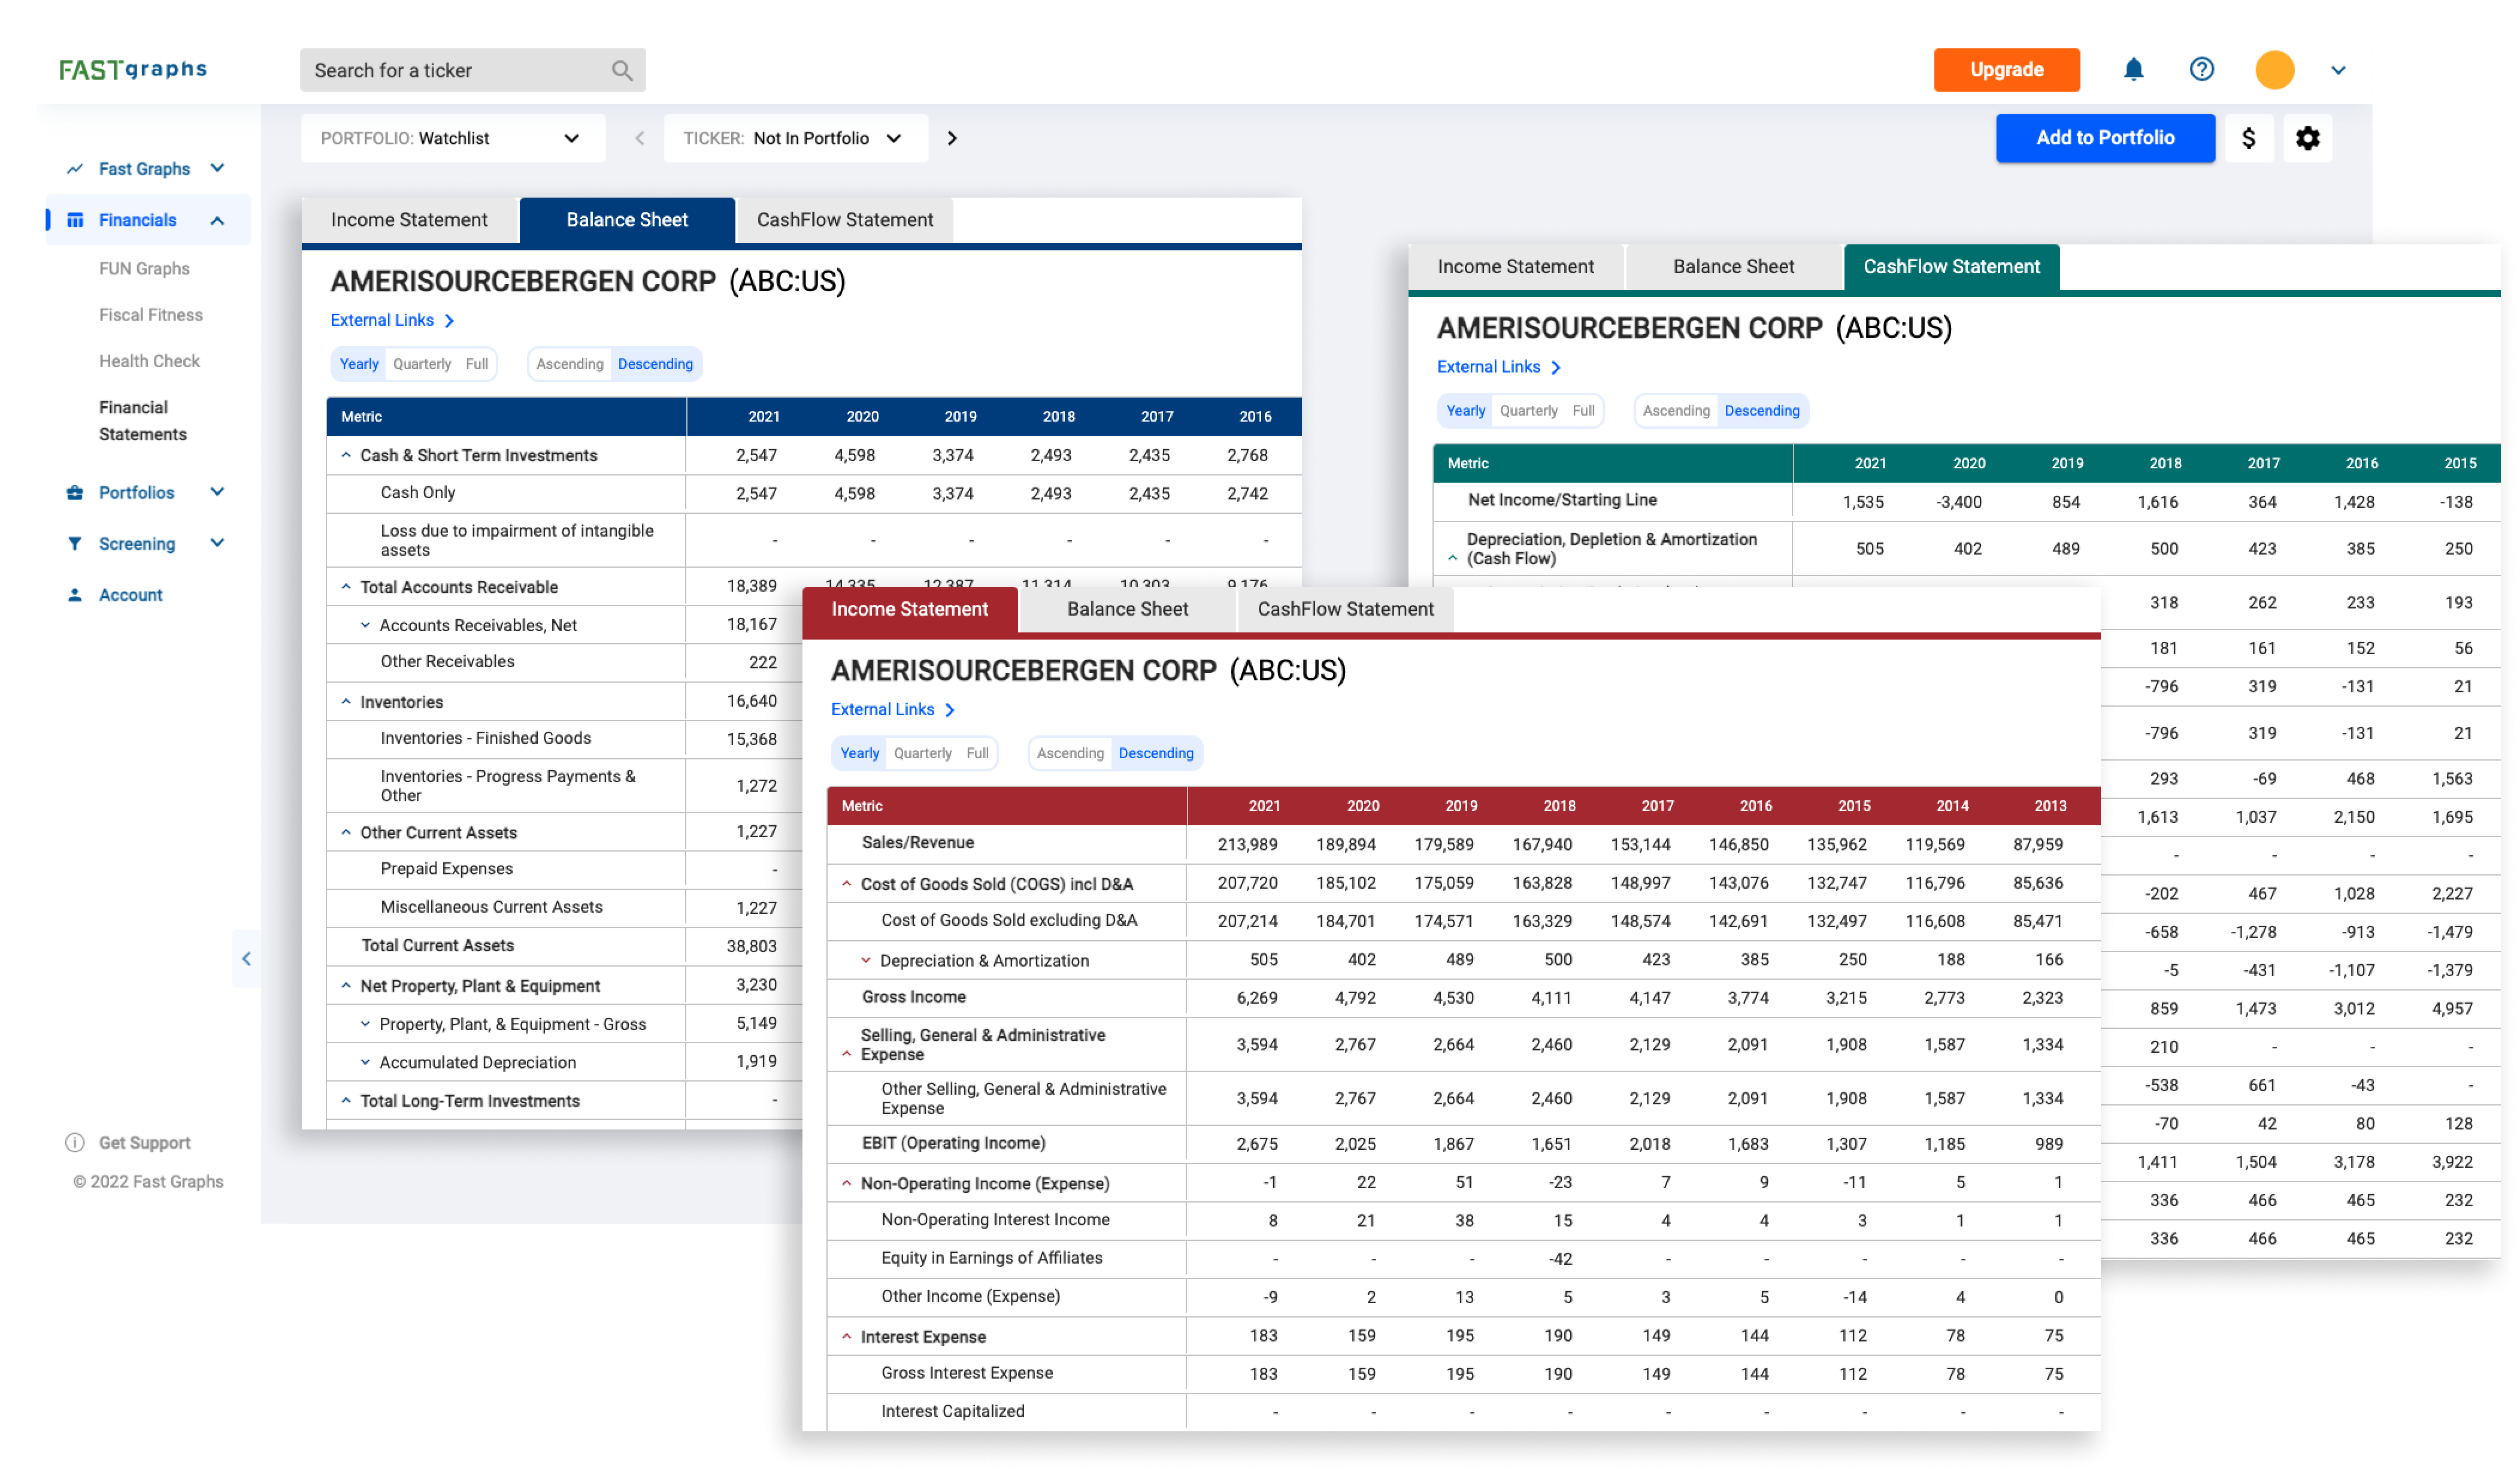
Create watchlists, track your investments, and create different views to understand the data within your portfolios.
Learn more about Portfolios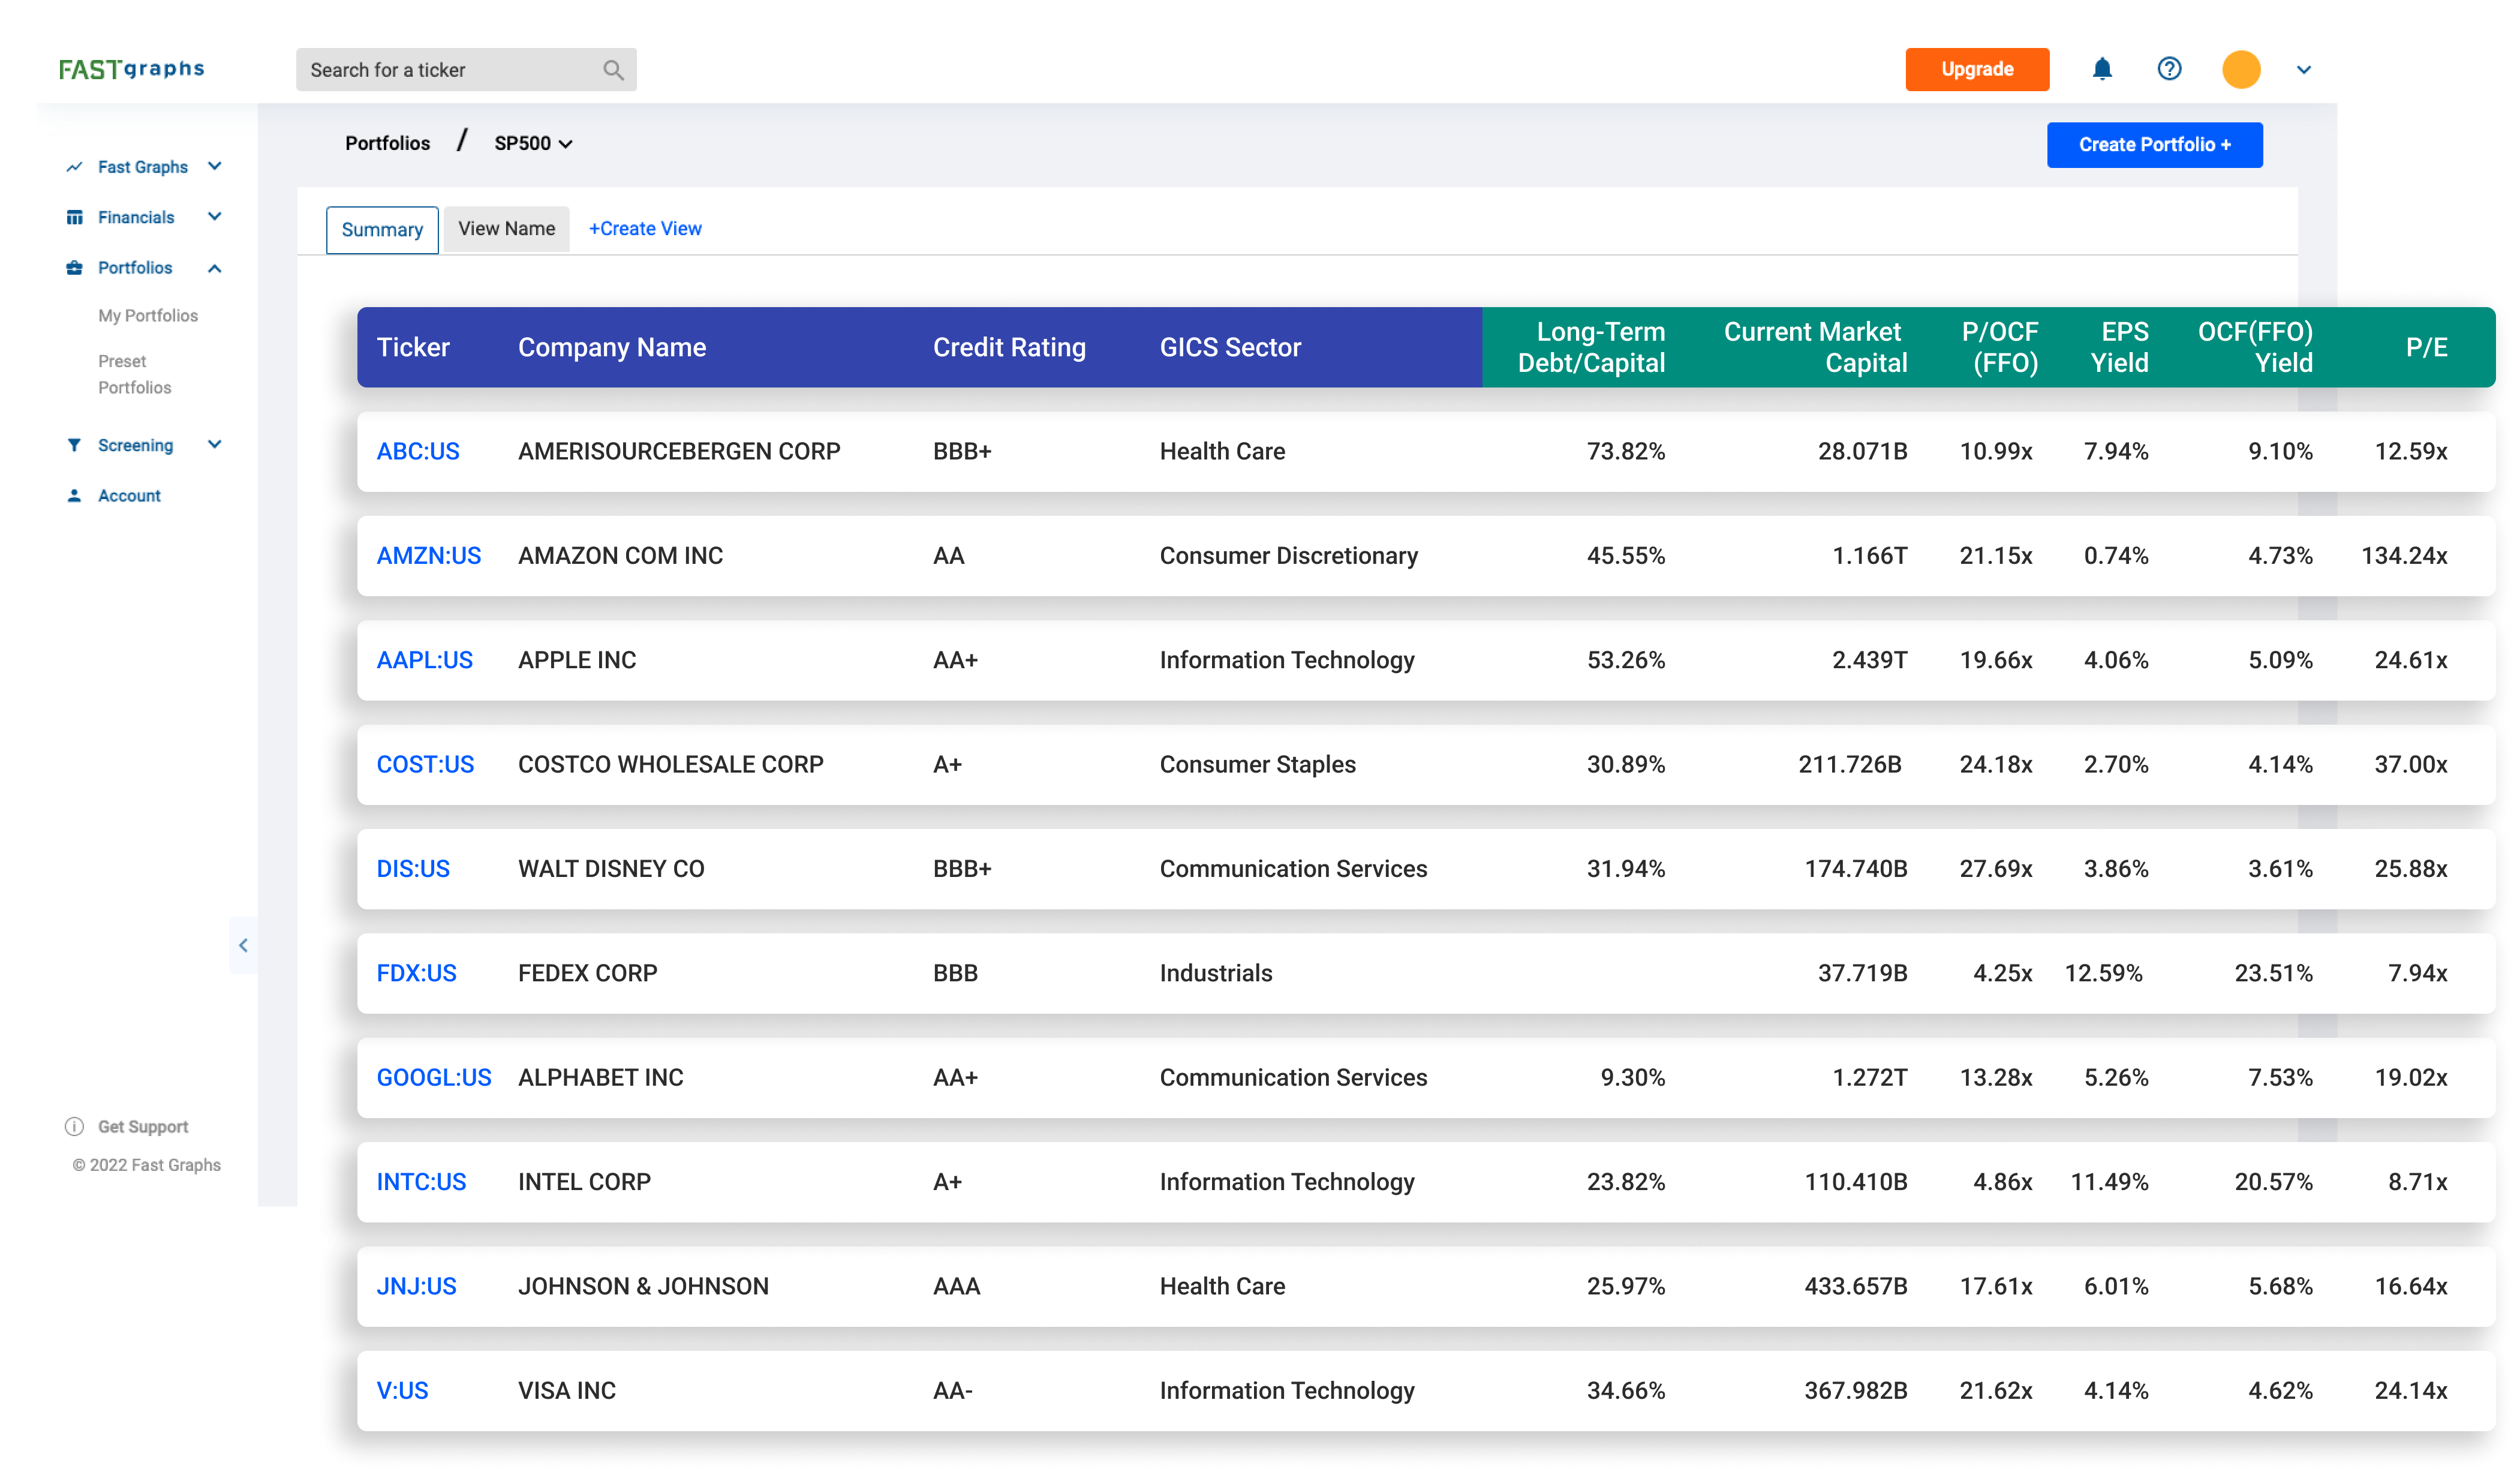
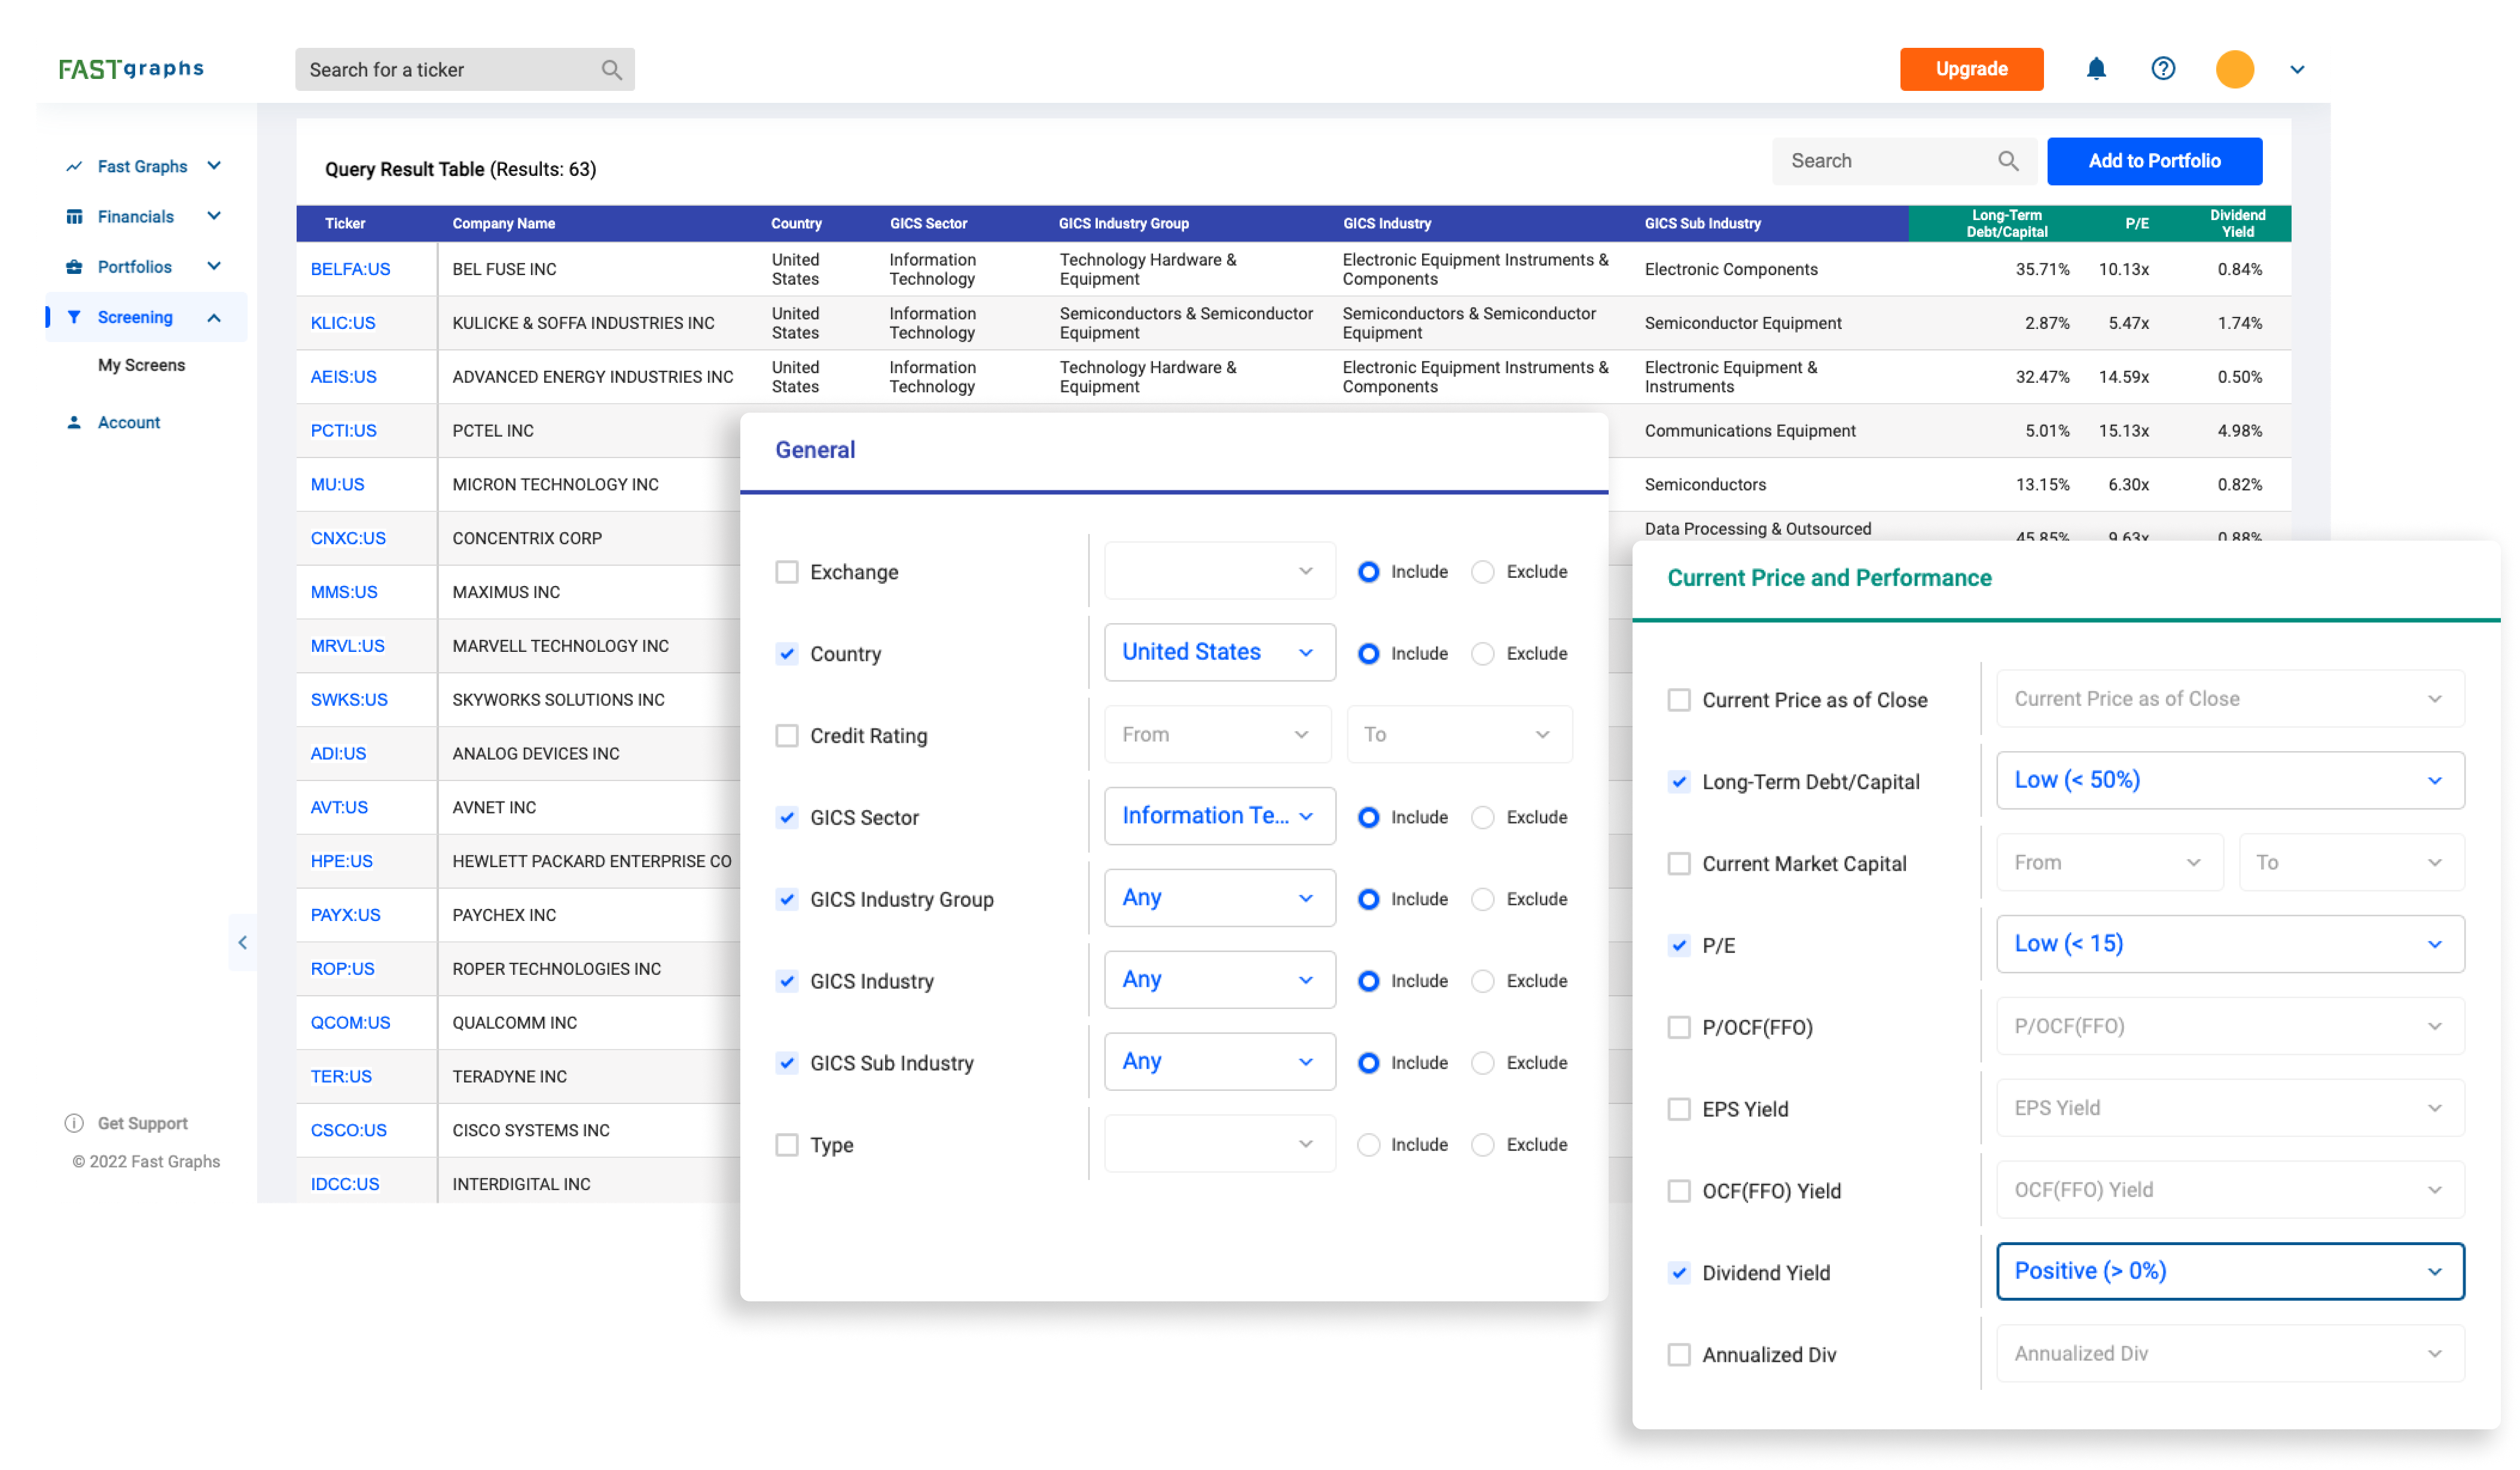
Create custom screens from 18,000+ stocks to research candidates and export to new or already built portfolios.
Learn more about Screening